Chart pattern recognition
Part I: Learning the Basics of Charting Theory
 Chart patterns can imply certain underlying market tendencies. In the first part of this tutorial, learn the basics of chart patterns and how to apply them when trading. Certain patterns, such as the head and shoulders, can suggest a reversal of a previous trend. Rectangles, pennants, and triangles, however, may suggest a continuation of a prevailing trend Chart patterns can imply certain underlying market tendencies. In the first part of this tutorial, learn the basics of chart patterns and how to apply them when trading. Certain patterns, such as the head and shoulders, can suggest a reversal of a previous trend. Rectangles, pennants, and triangles, however, may suggest a continuation of a prevailing trend
Part II: Customizing the Scanning Process
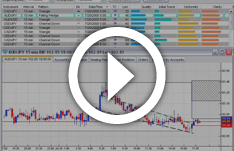
 Learn how to effectively scan for patterns using VT Trader to save you both time and effort! The second part of this tutorial explains how you can customize your scan results by modifying your filters in order to help you assess the market. Each pattern is presented with four indicators to gauge its quality: initial trend, uniformity, and clarity, and when applicable, the breakout strength. Learn how to effectively scan for patterns using VT Trader to save you both time and effort! The second part of this tutorial explains how you can customize your scan results by modifying your filters in order to help you assess the market. Each pattern is presented with four indicators to gauge its quality: initial trend, uniformity, and clarity, and when applicable, the breakout strength.
Part III: Trading Approaches Using Charting Theory
 The final part of this tutorial explores some of the approaches in trading chart patterns. Several case studies are presented on assessing continuation versus reversal patterns, and trading breakouts versus emerging patterns, so that you can get better insight into trading approaches when using chart patterns. Always remember to confirm the scanner's results visually The final part of this tutorial explores some of the approaches in trading chart patterns. Several case studies are presented on assessing continuation versus reversal patterns, and trading breakouts versus emerging patterns, so that you can get better insight into trading approaches when using chart patterns. Always remember to confirm the scanner's results visually

Open a DEMO account NOW and try the VT Trader 2.0 in action! |